
| Download the amazing global Makindo app: Android | Apple | |
|---|---|
| MEDICAL DISCLAIMER: Educational use only. Not for diagnosis or management. See below for full disclaimer. |
Introduction to ECGs
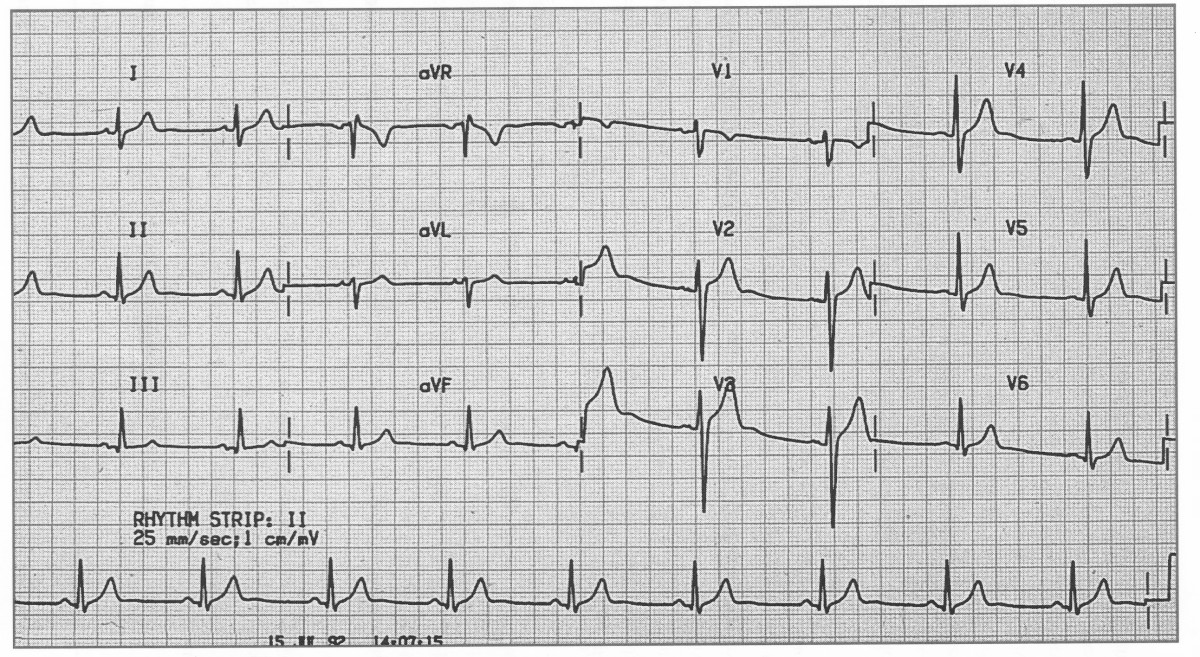
Before interpreting an ECG, always confirm the basics: ✅ Correct patient name and hospital/NHS number ✅ Correct date and time ✅ Speed (usually 25 mm/s) and gain (10 mm/mV) are clearly marked ✅ Ensure the ECG is technically adequate (no major artefact, all leads visible) ✅ Always review in clinical context - symptoms, medications, electrolytes, and comparison with previous ECGs.
Normal ECG showing sinus rhythm with standard calibration.
Another normal trace, demonstrating upright P waves and progressive R-wave amplitude across the precordial leads.
✅ Features of a Normal ECG
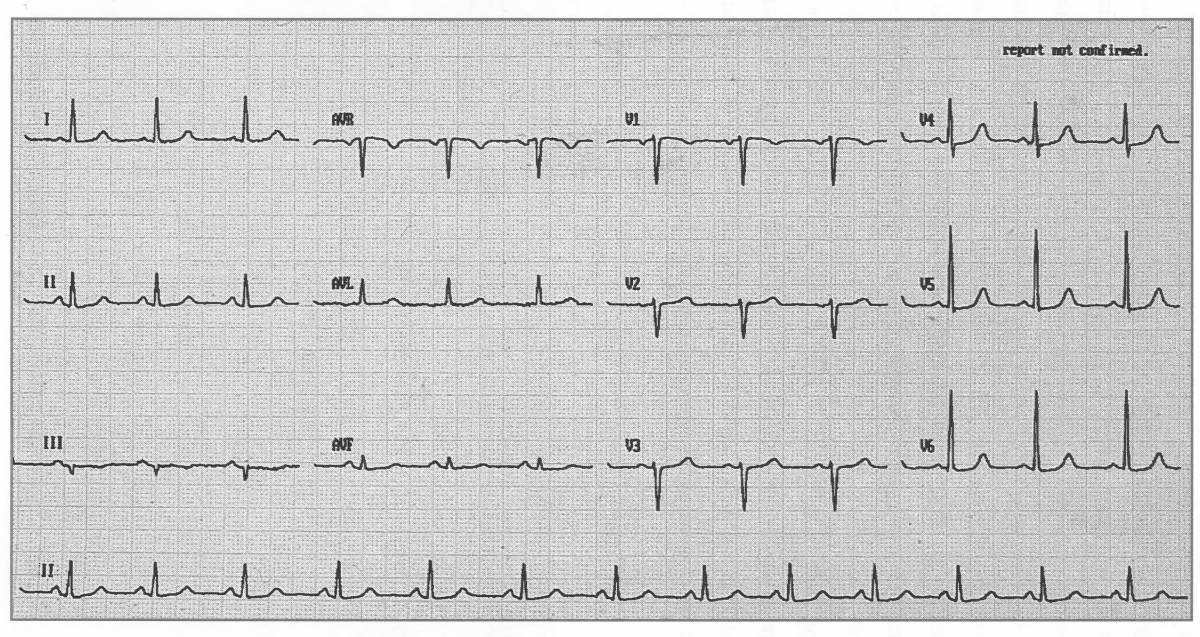
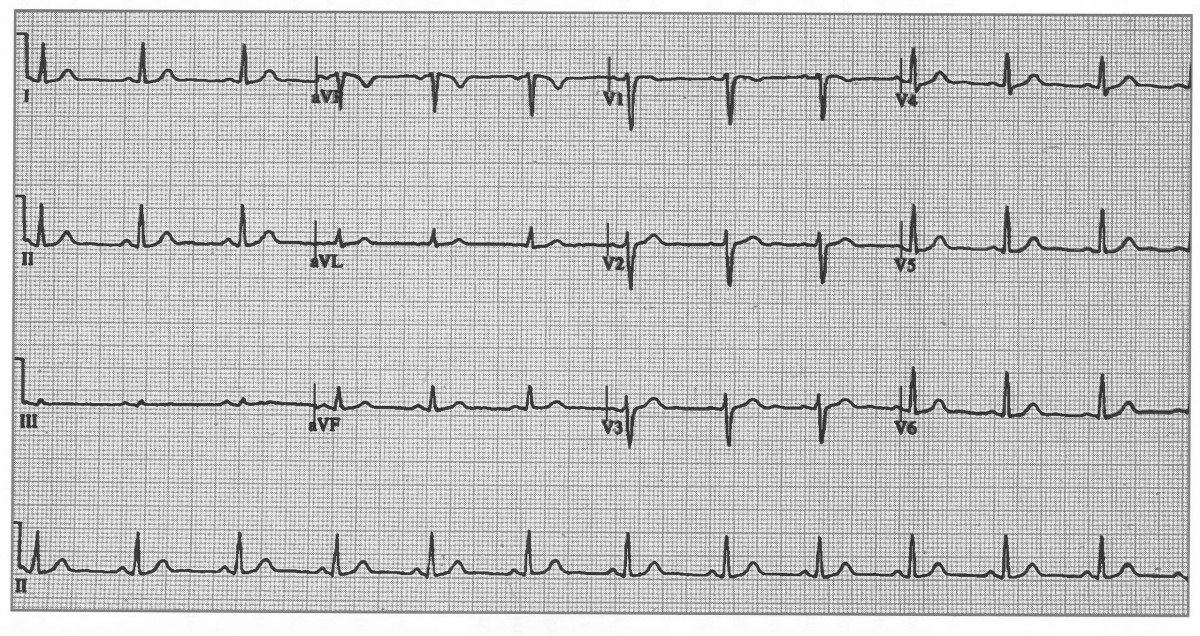
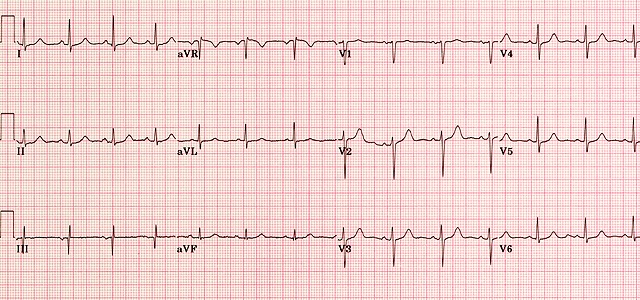
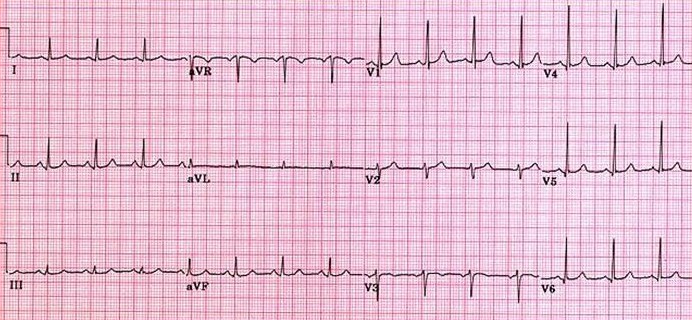
 A normal ECG (above) demonstrates regular sinus rhythm, rate around 82 bpm, and normal intervals throughout.
All deflections and segments are within physiological limits.
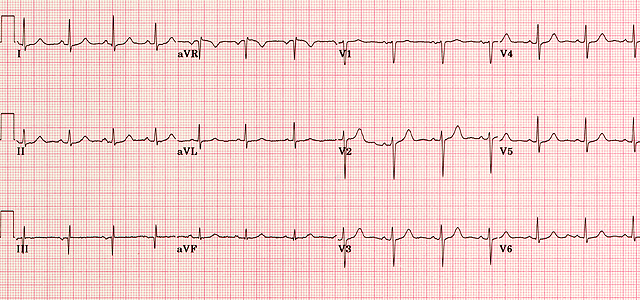
A normal ECG (above) demonstrates regular sinus rhythm, rate around 82 bpm, and normal intervals throughout.
All deflections and segments are within physiological limits.
🧭 Stepwise ECG Interpretation (UK Clinical Method)
Adopt a structured, reproducible approach each time you interpret an ECG:
- 👤 Check the patient details - name, date of birth, hospital/NHS number, and time recorded. Mislabelled ECGs can lead to catastrophic error.
- ⚙️ Check calibration - 25 mm/s speed and 10 mm/mV gain (1 mV = 10 mm vertically).
- 💓 Rate - Regular rhythm: 300/150/100/75/60/50 big-box method. Irregular rhythm: count QRS in 10 s ×6.
- 🔄 Rhythm - Is there a P wave before every QRS? Constant PR interval? Sinus rhythm = P upright in I, II, aVF and inverted in aVR.
- 🧭 Cardiac axis - Positive I and aVF → normal axis (−30° to +90°). I positive, aVF negative → left axis. I negative, aVF positive → right axis.
- 📏 Intervals - PR 120–200 ms; QRS ≤120 ms; QTc <440 ms (men) or <460 ms (women). Correct QT for rate (Bazett or Fridericia).
- 📊 Waves and segments - Evaluate each: P, QRS, ST, T, and U. Check morphology, amplitude, and concordance.
- 🩸 Compare - Always compare with old ECGs and correlate with symptoms and troponin results.
📏 Normal ECG Parameters
| Parameter | Normal range | Key teaching point |
|---|---|---|
| P wave | ≤110 ms, ≤2.5 mm height | Upright in I, II, aVF; biphasic in V1; negative in aVR. |
| PR interval | 120–200 ms | Prolonged = 1° AV block; short = pre-excitation. |
| QRS complex | ≤120 ms | Widened QRS = bundle branch block or ventricular rhythm. |
| QRS amplitude | >0.5 mV in limb, >1.0 mV in chest leads | High voltage → LVH; low → pericardial effusion/obesity. |
| ST segment | Isoelectric ±1 mm | Elevation/depression implies ischaemia or pericarditis. |
| T wave | Upright in I, II, V3–V6 | Inverted T may be normal in III, aVR, V1. |
| QT interval | ≤440 ms (M), ≤460 ms (F) | Prolonged QT → risk of torsades; correct for rate. |
| Axis | −30° to +90° | Left shift = LVH or inferior MI; right shift = RVH or PE. |
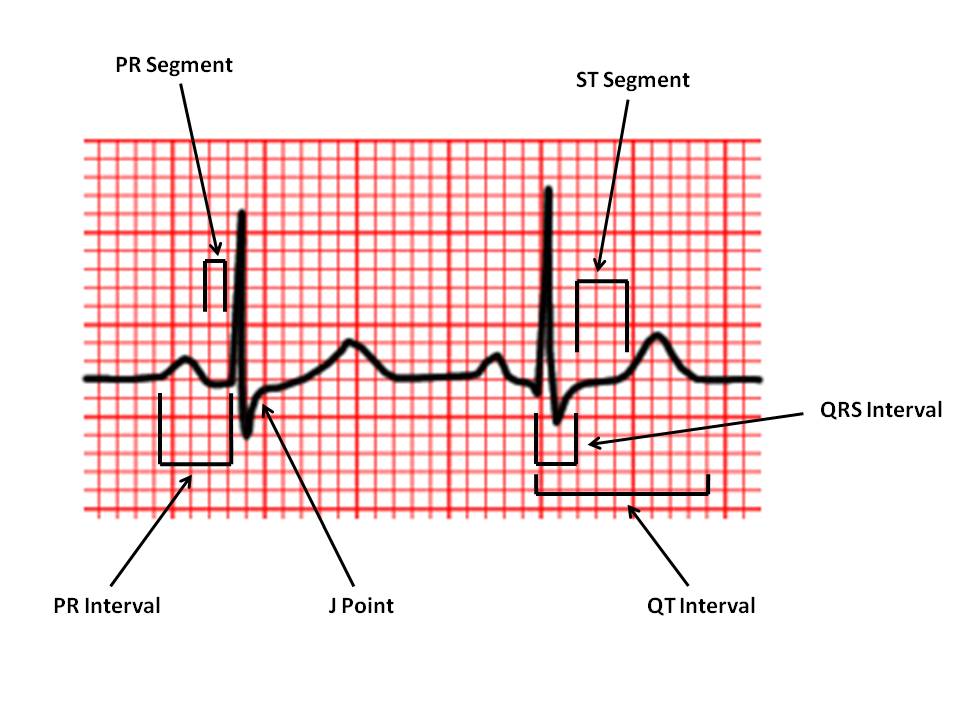
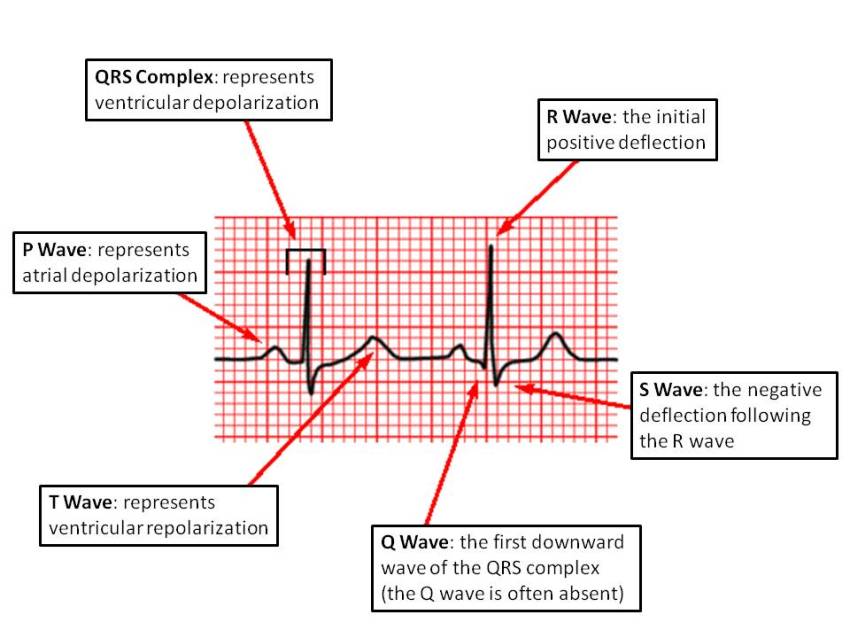
🔍 Key Waveform Components
1️⃣ P wave: Represents atrial depolarisation. Normal ≤0.11 s; smooth, rounded, upright in I, II, aVF. Bifid P = left atrial enlargement (P mitrale); peaked P = right atrial enlargement (P pulmonale).
2️⃣ PR interval: Measured from start of P to start of QRS. Normal 0.12–0.20 s. Prolonged = delayed AV conduction; short = accessory pathway (e.g. WPW).
3️⃣ QRS complex: Represents ventricular depolarisation. Normal ≤0.12 s. Look for bundle branch block patterns and R-wave progression V1→V6.
4️⃣ ST segment: Represents early ventricular repolarisation. Normally flat (isoelectric). ST ↑ > 1 mm in two contiguous leads → consider STEMI. ST ↓ > 0.5 mm → ischaemia or reciprocal change.
5️⃣ T wave: Represents ventricular repolarisation. Asymmetric, upright in most leads (except aVR, V1). Inverted T = ischaemia, strain, PE, or normal variant.
6️⃣ QT interval: Represents total ventricular depolarisation + repolarisation. Normal ≤0.44 s (M) or ≤0.46 s (F). Prolonged QT → risk of torsades (think hypokalaemia, macrolides, antipsychotics). Short QT → hypercalcaemia, digoxin effect.
⚡ Recognising Abnormal Patterns
- Ischaemia / STEMI ❤️🔥 - Localised ST elevation, reciprocal depression, new Q waves, evolving T inversion.
- Pericarditis ♨️ - Widespread concave ST elevation + PR depression; no reciprocal change.
- Hyperkalaemia 🔺 - Tall peaked T, PR prolongation, QRS widening → sine-wave.
- Hypokalaemia 🔻 - Flat T, U waves, prolonged QT.
- LVH / RVH 💪 - High voltage, strain pattern (ST depression, T inversion opposite QRS direction).
- Bundle Branch Blocks - RBBB (rsR′ V1), LBBB (broad notched R V6). LBBB + chest pain → treat as STEMI (until proven otherwise).
- PE (S1Q3T3) 🫁 - S in I, Q and T inversion in III; sinus tachycardia; right axis deviation.
🧠 Common UK Exam & OSCE Tips
- Start with: “This ECG is recorded at 25 mm/s and 10 mm/mV. It shows sinus rhythm at 78 bpm with a normal axis.”
- Describe the abnormality last, and conclude with likely cause: “…features of left ventricular hypertrophy with secondary repolarisation change, likely due to longstanding hypertension.”
- Always state the rate, rhythm, axis, intervals, and key wave/segment findings in OSCEs.
- Look for artefact, baseline wander, or poor lead placement before over-interpreting.
- Document serial ECGs - trend changes over time are diagnostically powerful. 📈
🧩 Rapid ECG Reference (Summary Card)
Checklist: ID → Calibration → Rate → Rhythm → Axis → Intervals → Morphology → ST/T → Comparison.
PR 120–200 ms • QRS ≤120 ms • QTc <440/460 ms • Axis −30°→+90° • ST isoelectric • Sinus rhythm = P upright I, II, aVF; negative aVR.
Always treat the patient, not the ECG.
| The content on this website is provided for educational and informational purposes only to support exam preparation (e.g., MLA, MRCP, USMLE) and learning. This is NOT medical advice, diagnosis, treatment, or professional guidance. It does not replace consultation with a qualified healthcare professional, official guidelines (e.g., NICE, GMC, BNF), or supervised clinical practice. Always verify information with current, authoritative sources. Makindo and its contributors accept no liability for any reliance on this content, including errors, omissions, or any resulting harm, loss, or consequences. By using this site, you agree to these terms. |
|
|
Categories
- About
- Acute Medicine
- Anaesthetics and Critical Care
- Anatomy
- Anatomy and Physiology
- Biochemistry
- Book
- Cardiology
- Collections
- CompSci
- Crib Sheets
- Dental
- Dermatology
- Differentials
- Drugs
- ENT
- Education
- Electrocardiogram
- Embryology
- Emergency Medicine
- Endocrinology
- Ethics
- Foundation Doctors
- GCSE
- Gastroenterology
- General Practice
- Genetics
- Geriatric Medicine
- Guidelines
- Gynaecology
- Haematology
- Hepatology
- Immunology
- Infectious Diseases
- Infographic
- Investigations
- Lists
- MRCP
- Mandatory Training
- Medical Students
- Microbiology
- Nephrology
- Neu
- Neurology
- Neurosurgery
- Nutrition
- OSCE
- OSCEs
- Obstetrics
- Obstetrics Gynaecology
- Oncology
- Ophthalmology
- Oral Medicine and Dentistry
- Orthopaedics
- Paediatrics
- Palliative
- Pathology
- Pharmacology
- Physiology
- Procedures
- Psychiatry
- Public Health
- Radiology
- Renal
- Respiratory
- Resuscitation
- Revision
- Rheumatology
- Statistics and Research
- Stroke
- Surgery
- Toxicology
- Trauma and Orthopaedics
- USMLE
- Urology
- Vascular Surgery